

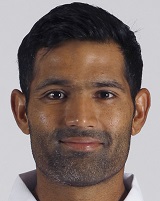
| Pakistan | |
| 36 Years (28 Jan, 1986) | |
| Male | |
| Karachi, Sind | |
| middle-order batter | |
| right-hand bat | |
| right-arm offbreak | |
| 2010 - 2020 |
| Sui Gas Corporation of Pakistan, Sindh Knights, Sind Dolphins, Sind, Quetta Gladiators, Punjab (Pakistan), Pakistan International Airlines, Pakistan Cricket Board Chairman's XI, Pakistan Cricket Board Blues, Pakistan Cricket Academy, Pakistan All Star XI, Pakistan A, North West Frontier Province Panthers, North West Frontier Province, Multan Sultans, Khyber-Pakhtunkhwa Fighters, Karachi Region Blues, Karachi Dolphins, Karachi Blues, Habib Bank Limited, Baluchistan, Pakistan |
|
Format
|
Span
|
Matches
|
Innings
|
NO
|
RUNS
|
Highest Innings Score
|
Batting Average
|
Balls Faced
|
Batting Strike Rate
|
100s
|
50s
|
0s
|
4s
|
6s
|
|---|---|---|---|---|---|---|---|---|---|---|---|---|---|---|
| Test | 2010-2020 | 77 | 128 | 6 | 4660 | 137 | 38.19 | 9588 | 48.6 | 12 | 27 | 13 | 512 | 29 |
| ODI | 2010-2017 | 60 | 58 | 4 | 1336 | 84 | 24.74 | 1979 | 67.5 | - | 9 | 5 | 108 | 5 |
| T20I | 2010-2012 | 10 | 10 | - | 192 | 38 | 19.2 | 185 | 103.78 | - | 0 | 0 | 19 | 2 |
| TEST+ODI+T20I | 2010-2020 | 147 | 196 | 10 | 6188 | 137 | 33.26 | 11752 | 52.65 | 12 | 36 | 18 | 639 | 36 |
|
Format
|
Span
|
Matches
|
Innings
|
Runs
|
Overs
|
Maidens
|
Wickets
|
Best Bowling in an Innings
|
Best Bowling in a Match
|
Average
|
Economy
|
Bowling Strike Rate
|
4 Wickets in an Innings
|
5 Wickets in an Innings
|
10 Wickets in an Innings
|
|---|---|---|---|---|---|---|---|---|---|---|---|---|---|---|---|
| Test | 2010-2020 | 77 | 15 | 196 | 56.4 | 1 | 3 | 1/7 | 1/18 | 65.33 | 3.45 | 113.3 | - | - | - |
| ODI | 2010-2017 | 60 | 2 | 18 | 2 | - | - | - | - | - | 9 | - | - | - | - |
| T20I | 2010-2012 | 10 | - | - | - | - | - | - | - | - | - | - | - | - | - |
| TEST+ODI+T20I | 2010-2020 | 147 | 17 | 214 | 58.4 | 1 | 3 | 1/7 | 1/18 | 71.33 | 3.64 | 117.3 | - | - | - |
|
Format
|
Span
|
Matches
|
Innings
|
Dismissals
|
Catches
|
Stumping
|
Catches as a keeper
|
Catches as a fielder
|
Max Dismissals in an Innings
|
Dismissals per Innings
|
|---|---|---|---|---|---|---|---|---|---|---|
| Test | 2010-2020 | 77 | 144 | 77 | 77 | - | - | 77 | 3 (3ct 0st) | 0.534 |
| ODI | 2010-2017 | 60 | 59 | 14 | 14 | - | - | 14 | 2 (2ct 0st) | 0.237 |
| T20I | 2010-2012 | 10 | 10 | 3 | 3 | - | - | 3 | 1 (1ct 0st) | 0.3 |
| TEST+ODI+T20I | 2010-2020 | 147 | 213 | 94 | 94 | - | - | 94 | 3 (3ct 0st) | 0.441 |
|
Format
|
Span
|
Matches
|
Runs
|
Highest Innings Score
|
Batting Average
|
100s scored
|
Wickets
|
Best Bowling in an Innings
|
5 wickets in an Innings
|
Catches
|
Stumping
|
Bowling Average
|
Average Difference
|
|---|---|---|---|---|---|---|---|---|---|---|---|---|---|
| Test | 2010-2020 | 77 | 4660 | 137 | 38.19 | 12 | 3 | 1/7 | - | 77 | - | 65.33 | -27.13 |
| ODI | 2010-2017 | 60 | 1336 | 84 | 24.74 | - | - | - | - | 14 | - | - | - |
| T20I | 2010-2012 | 10 | 192 | 38 | 19.2 | - | - | - | - | 3 | - | - | - |
| TEST+ODI+T20I | 2010-2020 | 147 | 6188 | 137 | 33.26 | 12 | 3 | 1/7 | - | 94 | - | 71.33 | -38.06 |